
uProfiler Community 1.0是面向主题的JVM性能监控和分析工具,它利用字节码技术分析class,收集函数的执行耗时,并以图形化的界面实事显示JVM性能。不同于 JVisual VM系统层面的监控和分析,uProfiler面向主题,监控当前JVM的运行情况,让系统管理人员及时发现APP运行期的状态,有助于开发人员快速的发现和定位代码中潜在的问题。
主要功能有:
- 轻量级的函数执行耗时收集框架,并以JMX接口提供对外访问,占用资源少
- 面向主题的类分析和归类,目前内置了Spring、Struts框架代码执行分析器。
- 支持自定义主题
- 跟踪当前JVM中所执行的SQL语句
- 图形化、表格化的监控客户端
使用方法:下载uProfiler Community 1.0发行版后,解压后,切换到example目录,执行下面的命令(假设您已经安装并配置好了Maven),
export MAVEN_OPTS="-javaagent:../lib/uAgent-1.0.0.jar -Dagent.config=src/main/resources/agent.properties -Dcom.sun.management.jmxremote.port=9999 -Dcom.sun.management.jmxremote.authenticate=false -Dcom.sun.management.jmxremote.local.only=false -Dcom.sun.management.jmxremote.ssl=false"

##  对于windows系统
set MAVEN_OPTS="-javaagent:../lib/uAgent-1.0.0.jar -Dagent.config=src/main/resources/agent.properties -Dcom.sun.management.jmxremote.port=9999 -Dcom.sun.management.jmxremote.authenticate=false -Dcom.sun.management.jmxremote.local.only=false -Dcom.sun.management.jmxremote.ssl=false"
然后启动example工程
mvn jetty:run
然后双击执行发行版中的uProfiler_Client.jar或者在终端执行,
java -jar uProfiler_Client.jar
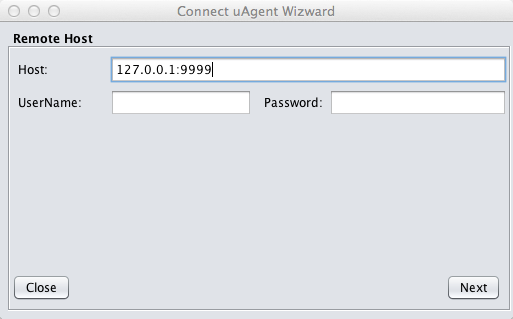
点击New按钮按照向导界面,连接到127.0.0.1:9999 JMX服务端口,在浏览器中输入http://localhost:8080/resources/file.html,上传文件,查看图形界面的变化.


下载地址:http://sourceforge.net/projects/uprofiler/files/uProfiler%20Community%201.0%20dist.zip/download
@仪山湖


相关推荐
MySQL 8.0.1.0-dmr 数据库 下载 mysql-installer-community-8.0.1.0-dmr.msi 下载。
CLC CCIE EI SDWAN PRACTICE LAB v1.0 Community Verison
ArangoDB Community Edition(arangodb3-3.8.4-1.0.x86_64.rpm),适用于CentOS系统。 ArangoDB是一个原生多模型数据库,兼有key/value键/值对、graph图和document文档数据模型,提供了涵盖三种数据模型的统一的...
mysql-community-client-8.0.3-0.1.rc.el7.x86_64.rpm
Product : Ext.NET Pro Version : 1.0.0 RC1 Last Updated : 2010-11-02 Ext.NET is an open source ASP.NET (WebForm + MVC) component framework integrating the cross-browser Sencha Ext JS JavaScript Library...
图形化数据库SQLyog,解压后就可以使用了,用起来很还不错
ArangoDB Community Edition(arangodb3-client-3.8.4-1.0.x86_64.rpm)客户端,适用于CentOS系统。 ArangoDB是一个原生多模型数据库,兼有key/value键/值对、graph图和document文档数据模型,提供了涵盖三种数据...
mysql-installer-community-5.7.31.0 mysql-installer-community-5.7.31.0 mysql-installer-community-5.7.31.0 mysql-installer-community-5.7.31.0 mysql-installer-community-5.7.31.0 mysql-installer-community...
ArangoDB Community Edition(arangodb3-debuginfo-3.8.4-1.0.x86_64.rpm),适用于CentOS系统。 ArangoDB是一个原生多模型数据库,兼有key/value键/值对、graph图和document文档数据模型,提供了涵盖三种数据模型的...
TomahawkTools 1.0 for Dreamweaver (Community Edition) 支持DreamWeaver cs3 目前全国唯一可以下载的地方。 免费版,无需注册。
VS2019在安装的过程中,偶尔遇到报错Microsoft.VisualStudio.Community.Msi 报错的问题。怎么卸载重装都没用。用这个工具,打开后选择->卸载->vs_communitymsi 然后等待修复完毕,再重新尝试安装VS即可 VS2019在安装...
MySQL Community Server 8.0.28 (mysql-community-server-8.0.28-1.sl15.x86_64.rpm) 适用于 SUSE Linux Enterprise Server 15 (x86, 64-bit), RPM Package MySQL Server
IBM Db2 Community Edition v11.5.6 (v11.5.6_ntx64_server_dec)适用于Microsoft Windows (x64),文件分割成 2 个压缩包,必须集齐 2 个压缩包才能一起解压一起使用: Db2 Community Edition v11.5.6 (v11.5.6_...
vs2017_community__社区版_官方最新安装包v15.9。 community,社区版,含基本的开发功能,免费!免费!免费! 如果只是一般的开发,community,社区版,足够用了。
mysql-community-common-5.7.13-1.el7.x86_64.rpm mysql-community-libs-5.7.13-1.el7.x86_64.rpm mysql-community-devel-5.7.13-1.el7.x86_64.rpm mysql-community-client-5.7.13-1.el7.x86_64.rpm mysql-...
neo4j-community-3.5.5
mysql-workbench-community-8.0.19-winx64.zipmysql-workbench-community-8.0.19-winx64.zipmysql-workbench-community-8.0.19-winx64.zipmysql-workbench-community-8.0.19-winx64.zipmysql-workbench-community-...
是CS1.0发布前的最后一个Beta版,感觉非常不错! 官方发布的源码并不能顺利安装,主要是sql脚本对中文SQL Server支持不好,将修正后的脚本及安装说明打包附上。
mysql-community-common-8.0.20-1.el7.x86_64.rpm
MySQL Community Server 8.0.31(mysql-installer-community-8.0.31.0.msi),适用于Windows x32位和x64位系统。